Breaches between runs
A limit crossed at 14:20 and back by 16:00 may never appear in the evening report.
Limits and controls
Many limits and controls are checked once a day, in a report. Calseda checks each one whenever its figure changes, explains every breach with its causes, logs it, and tells the team that owns it.
What you can't see today
A limit crossed at 14:20 and back by 16:00 may never appear in the evening report.
A report says a limit was breached. It doesn't say which trade or price move caused it.
A control that passes on stale data looks the same as one that passes on today's.
Limits live in spreadsheets and emails, and changes are hard to trace afterwards.
What you'd see instead
A desk's position crosses its limit after a sharp price move. Nobody knows: the control runs in the overnight report.
The breach appears in a report. By the time someone emails the desk to ask why, the position has changed.
The figure crosses its limit. The breach is recorded with its time and causes: the price move and the position behind it.
An alert reaches the owning team where it already works, such as Teams or Slack. Once, not every second.
The position is reduced. The figure goes back within its limit, and the alert clears.
The whole episode is in the log: when it started, why, where the alert went, and when it ended.
An example with simulated data.
Each limit is checked whenever its figure changes, not once a day.
Each breach carries the inputs that caused it, and how fresh each one was.
When it started, what caused it, where the alert went, and when it cleared.
One alert per crossing, sent where the owning team already works. It clears when the figure is back within its limit, so people keep reading alerts.
See it in a demo
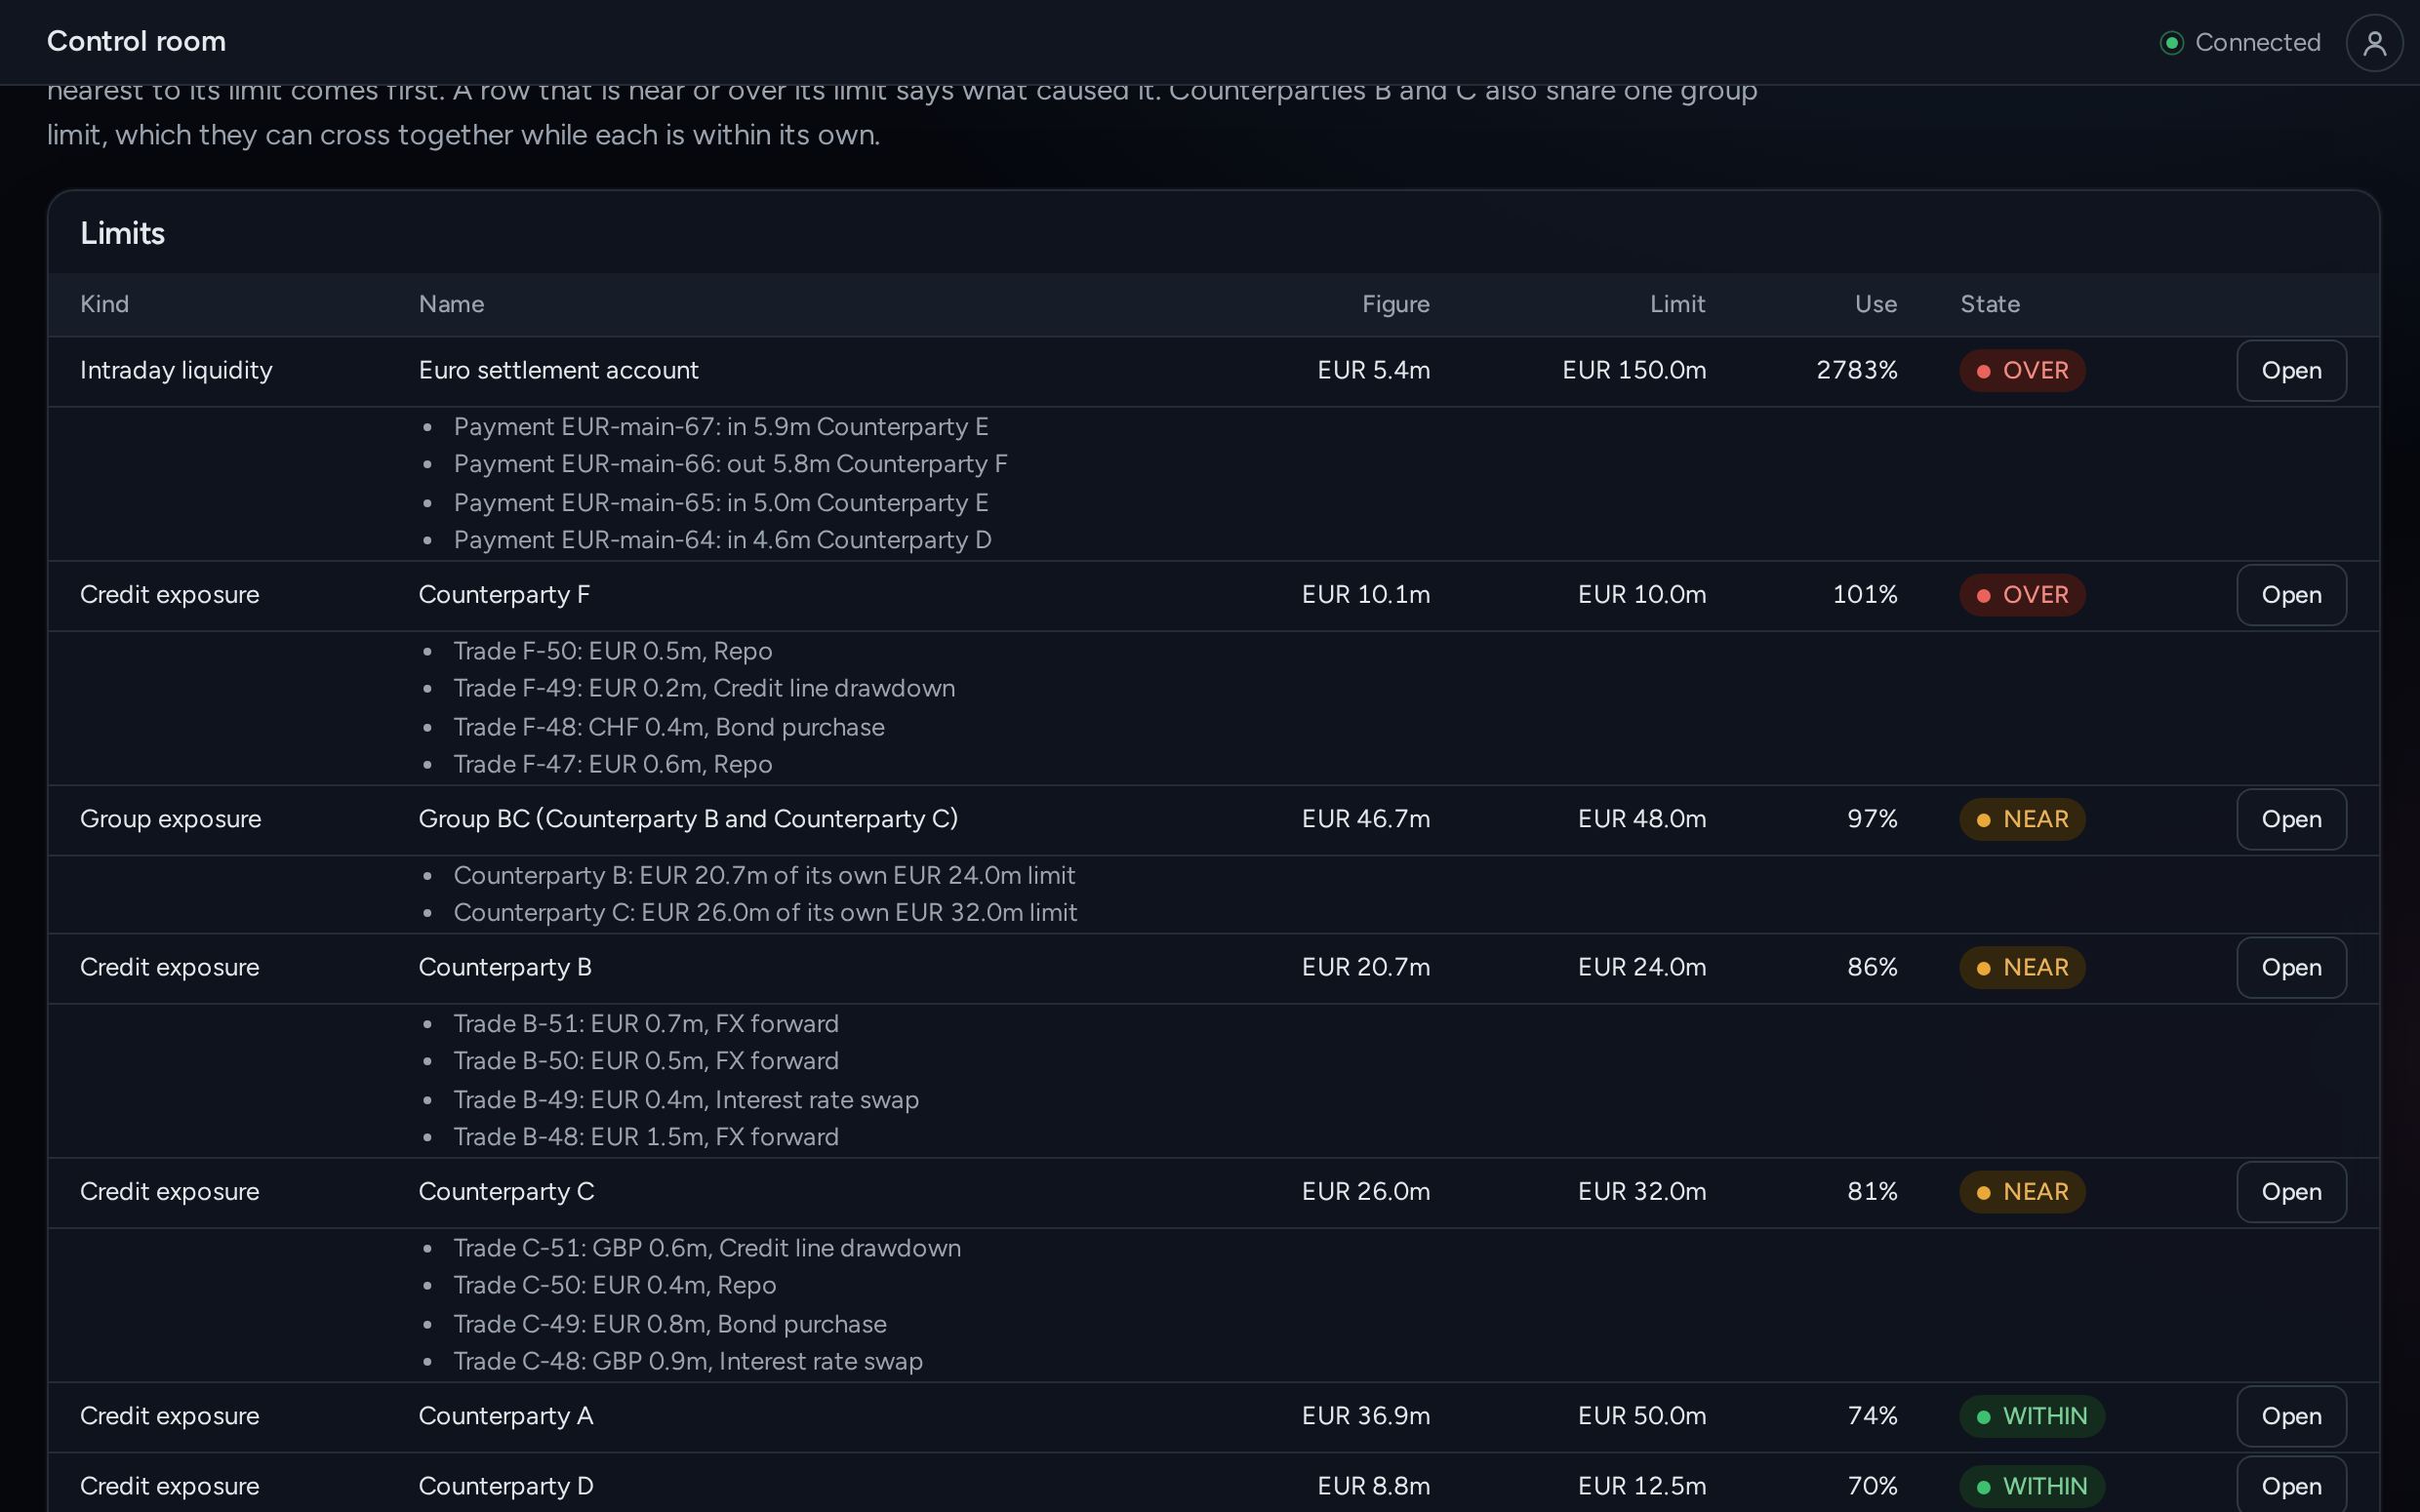
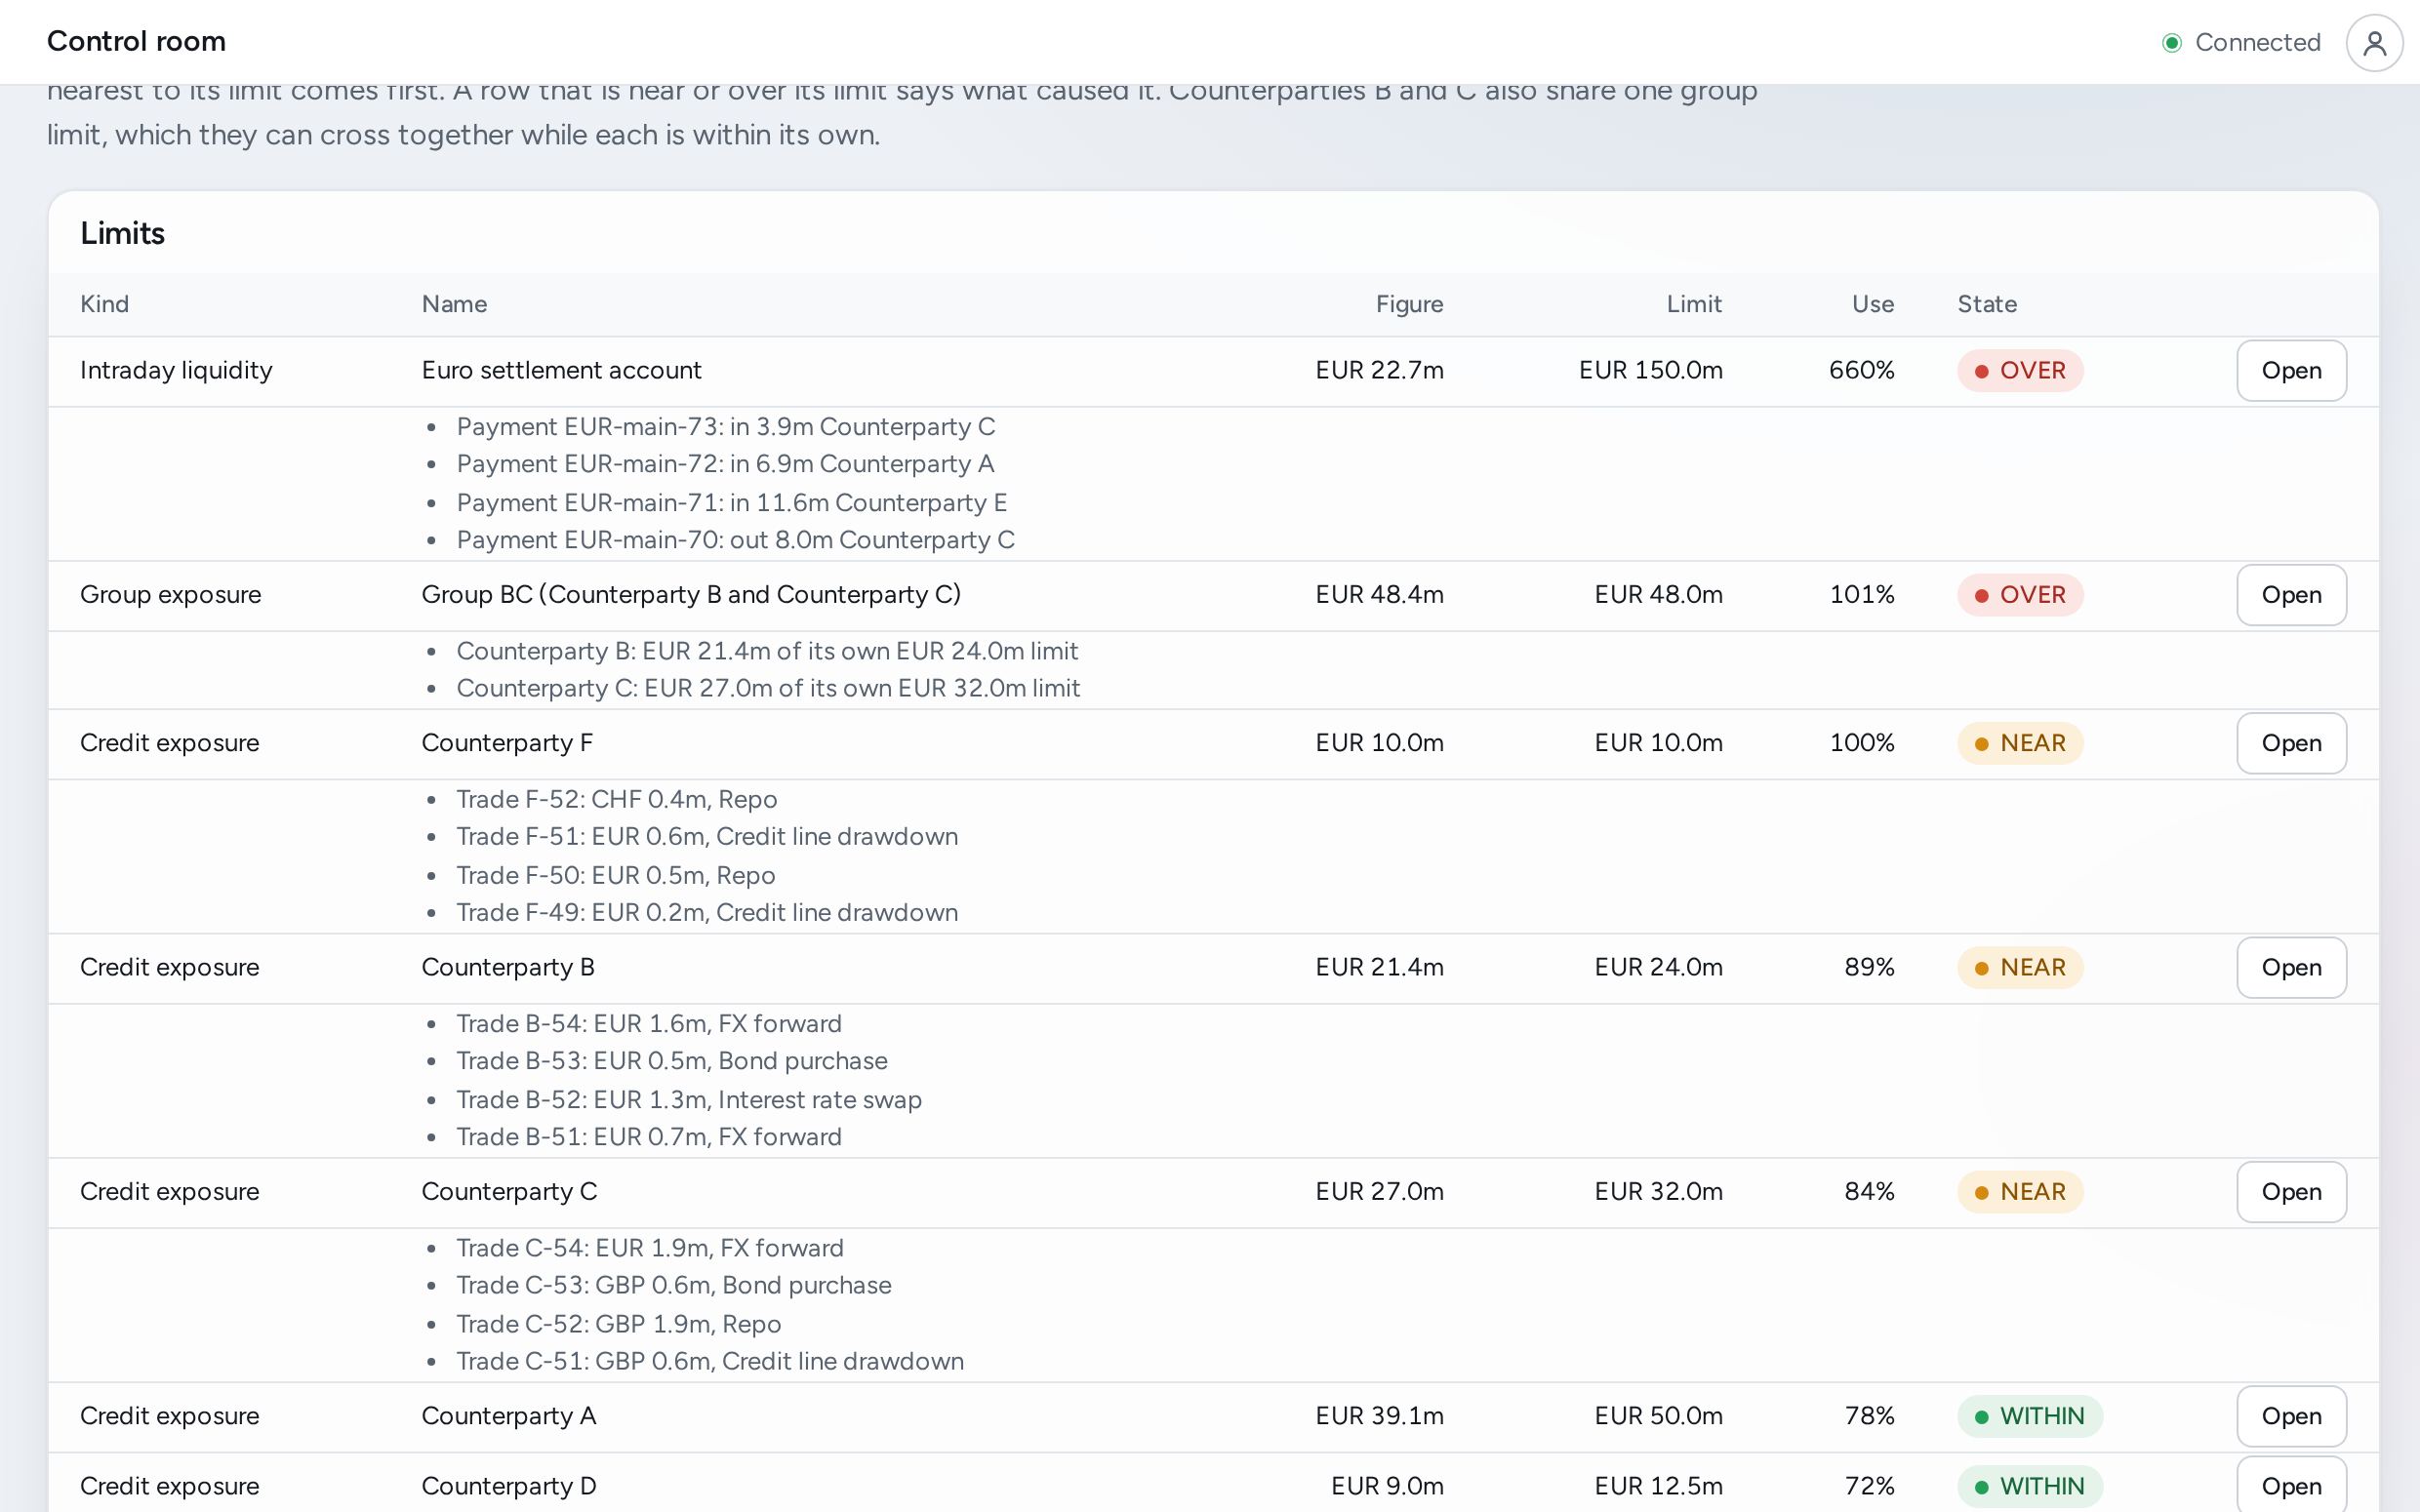
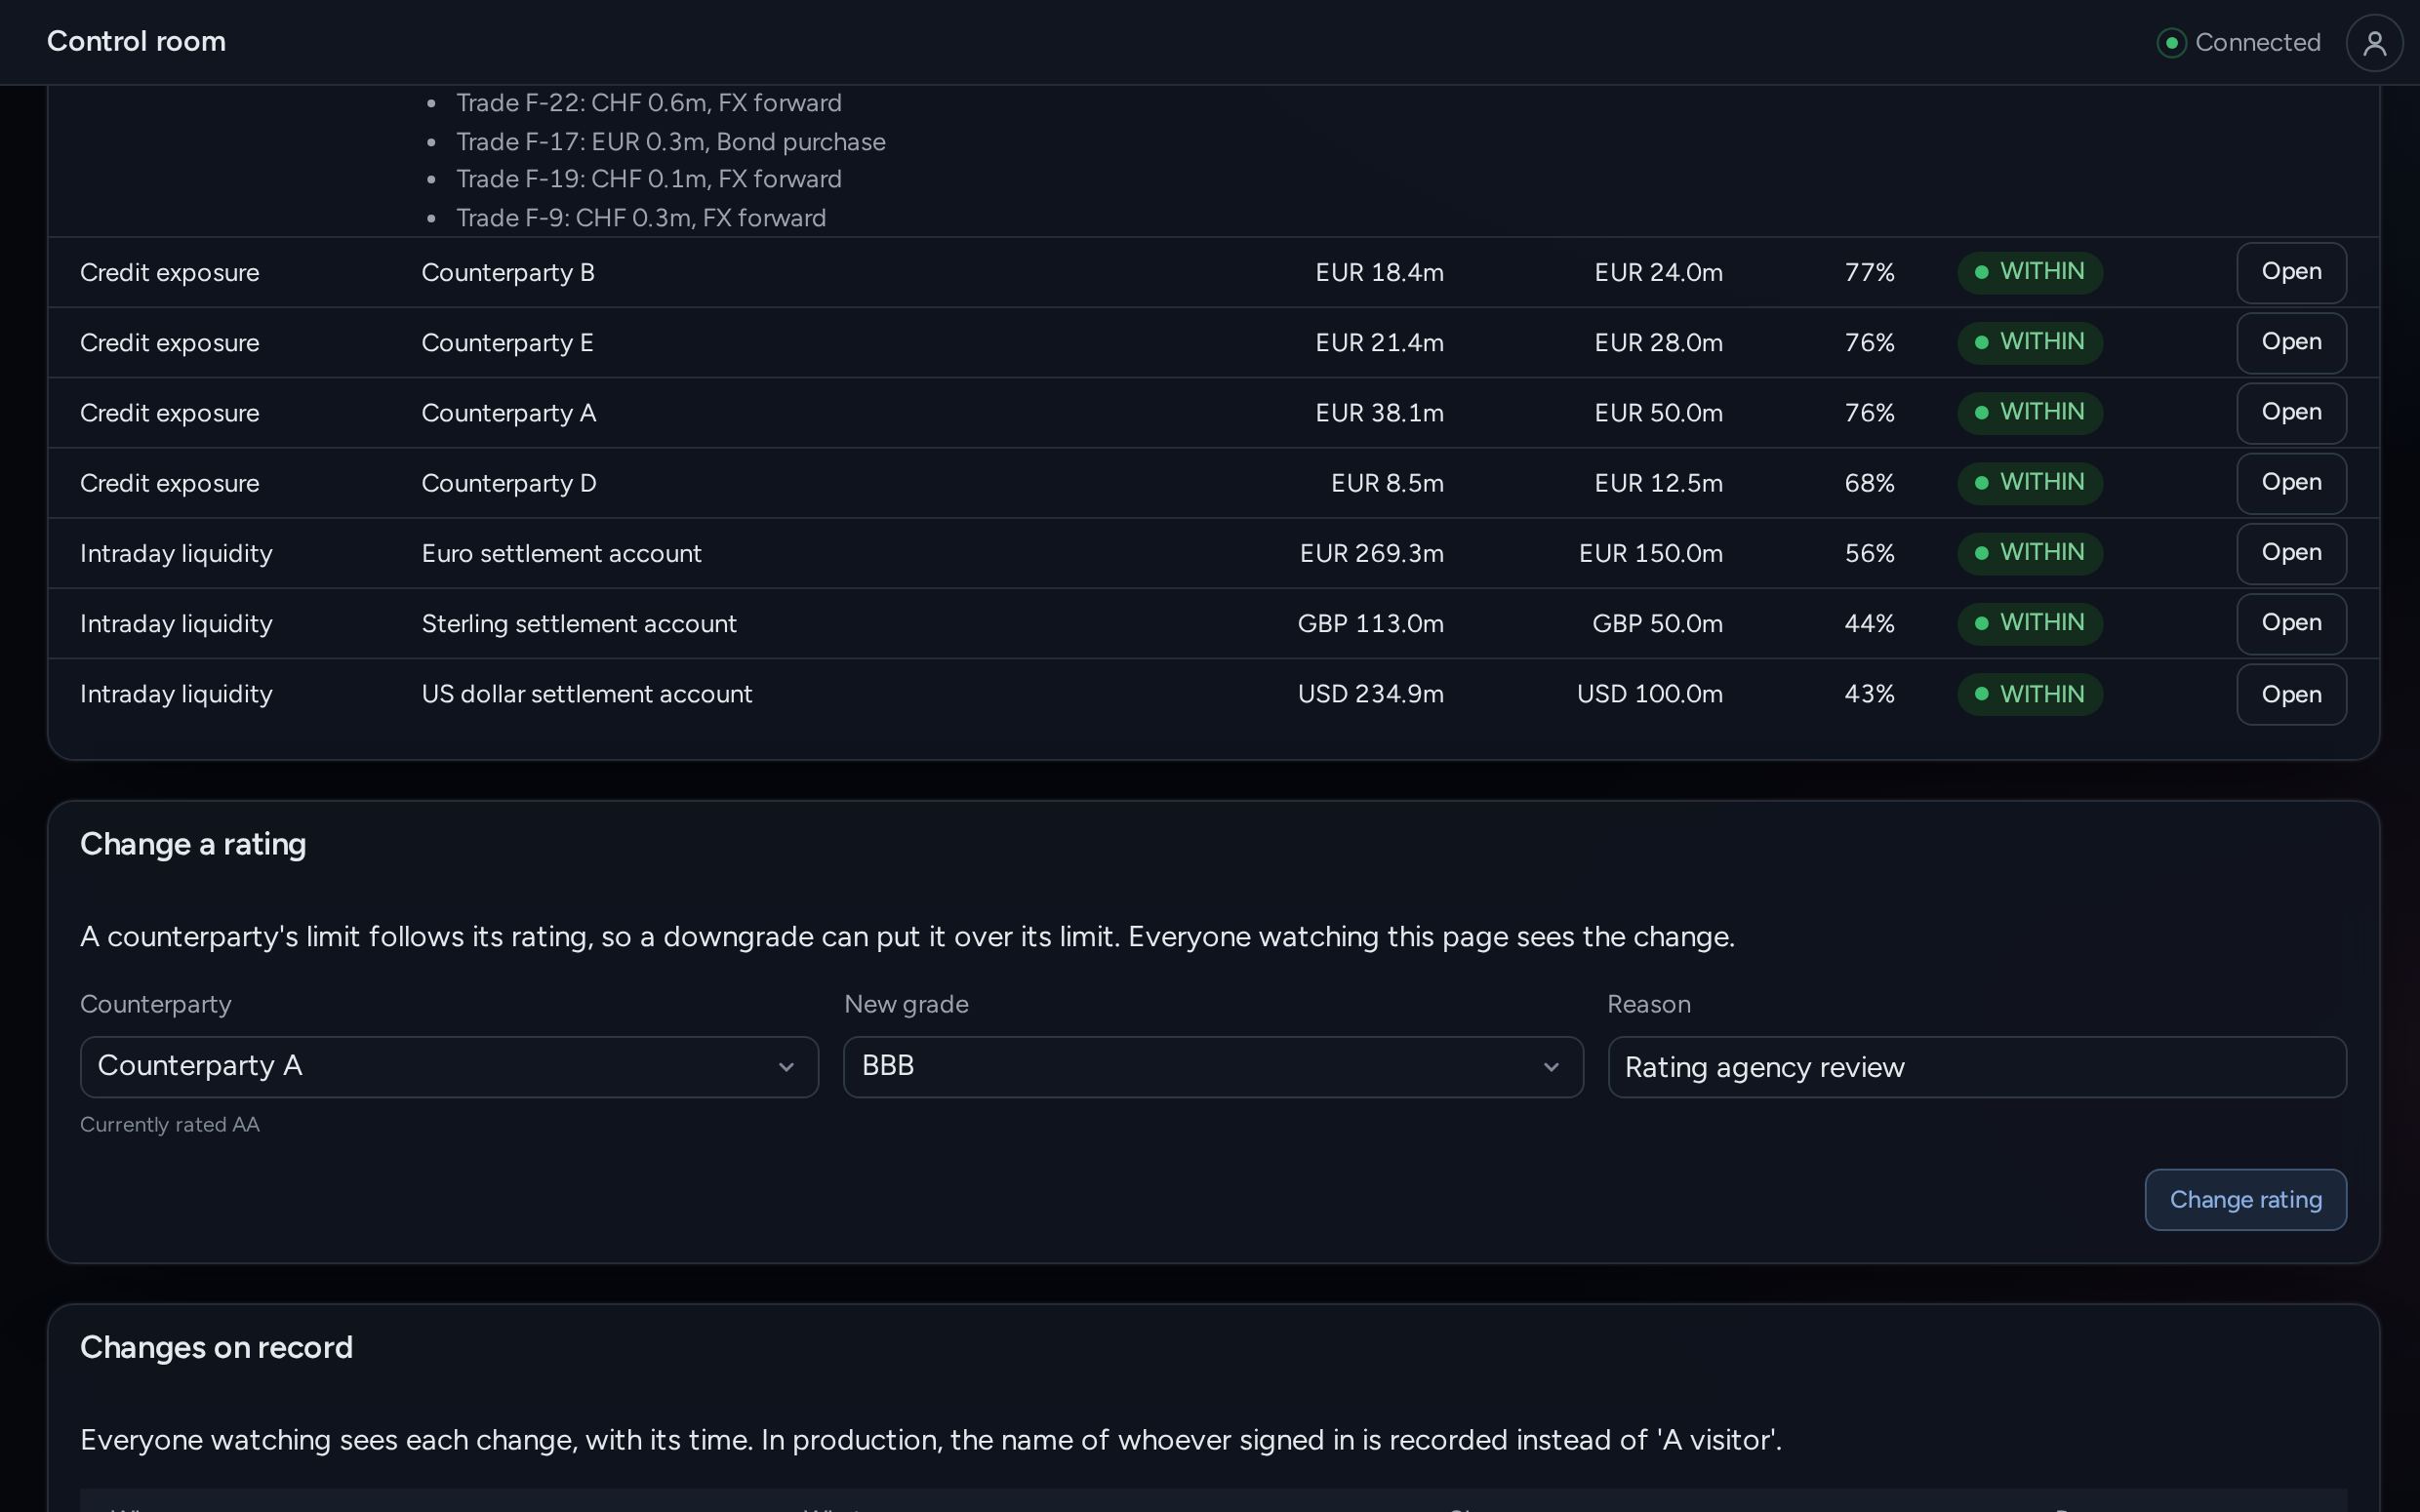
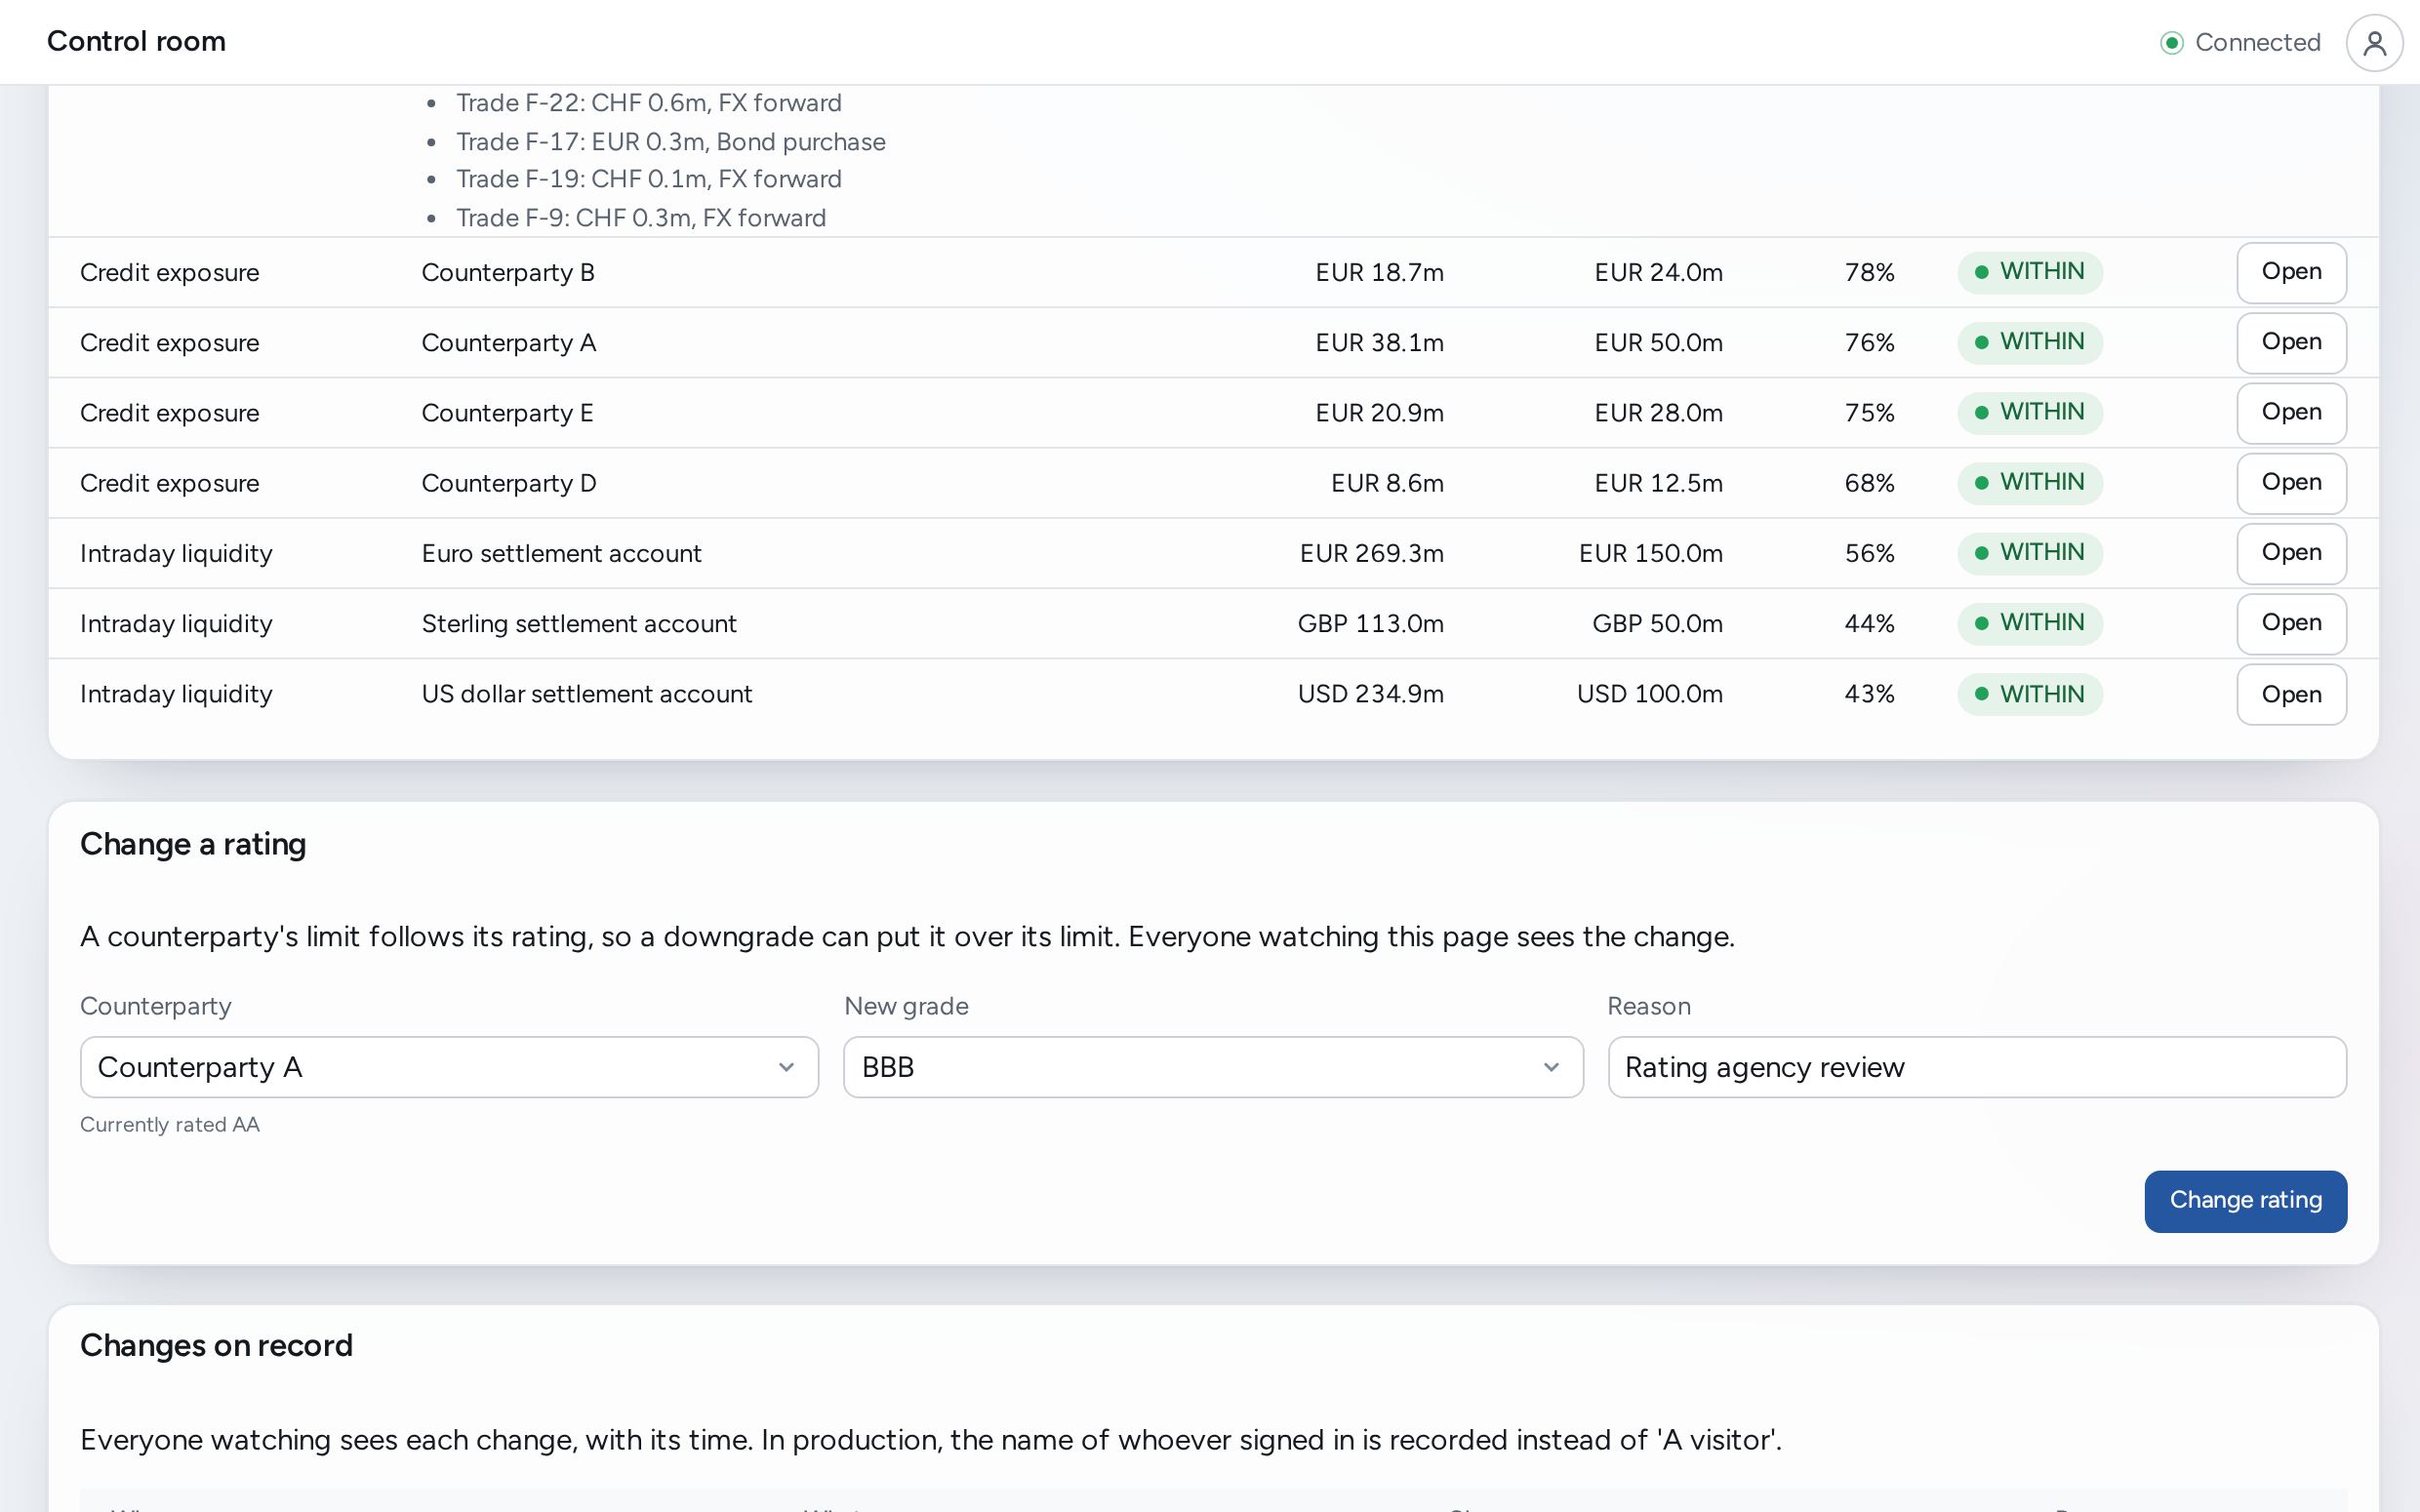
In a demo, a simulated bank's credit limits and its settlement accounts' minimums sit on one board. A row near or over its limit lists what caused it. Every change a visitor makes is on record with its time.
Use it yourself, no sign-in: Every limit, watched all day ↗
What changes for your team
The team hears about a breach while something can still be done about it.
Limits and who is told are set by your team, for example from Excel. Each change is checked, and logged with who posted it.
What your regulator or auditor gets
How it starts
For example, the position limits of one desk, or the concentration limits of one portfolio.
The data behind each figure, and the limits themselves, read from where they already live. Nothing is replaced.
Your team chooses where each alert goes. Your developers, or ours, write the calculation behind each figure.
It runs alongside today's report, so your team can compare the two before relying on it.
Become a design partner: a pilot on generous terms, in exchange for a case study published only with your approval.