Which inputs
A figure passes through extracts and spreadsheets. Its exact inputs are no longer written down anywhere.
Regulatory data
When a supervisor or an auditor asks how a figure was produced, most teams rebuild the answer by hand. With Calseda each figure shows the exact values of the inputs it was calculated from, each with its source and its freshness. Posted changes are logged with who posted them.
What you can't see today
A figure passes through extracts and spreadsheets. Its exact inputs are no longer written down anywhere.
Nobody can say whether a price or a balance behind a figure was from this morning or from last week.
A manual adjustment in a spreadsheet changes a reported figure, and nobody remembers who made it.
In a stressed week, a new question from a supervisor becomes a project when an answer is needed the same day.
What you'd see instead
The question arrives. A team starts tracing the figure back through spreadsheets and batch logs.
They have found a manual adjustment that nobody remembers making. An answer goes back, with caveats about what could not be traced.
Open the figure. See the exact values of the inputs it was calculated from, and the calculation or source system each one came from.
Each input shows when its data is from and when it arrived, and is flagged if it was older than its source should allow.
A manual override is one of those inputs, with its source. The log says who posted it, and when.
Risk has its answer while the figure still stands, without rebuilding it from spreadsheets and batch logs.
An example. The days are illustrative.
Themes you will recognise
The Basel Committee's principles for effective risk data aggregation and risk reporting (BCBS 239) ask, among other things, for accurate and timely risk data. They also ask for clear governance and for the ability to answer new questions quickly.
| Theme | What Calseda shows |
|---|---|
| Accuracy and integrity | Each figure's exact input values and their sources, captured as the figure is calculated, not reconstructed later. |
| Timeliness | Figures recalculated when their data changes, and flagged when an input is older than its source should allow. |
| Adaptability | New questions asked as private "what if?" calculations on the live data, without a new project. |
| Governance and control | Roles that decide who may do what, and a log of who posted each change. |
Calseda does not make an organisation compliant with any regulation, and holds no certification against any standard. It gives your teams evidence for the questions these principles raise.
See it in a demo
In a demo, every row on a bank's limit board opens to the inputs behind it, each with the system it came from and its age. Another page shows how data flows through the whole server, from each source to each result.
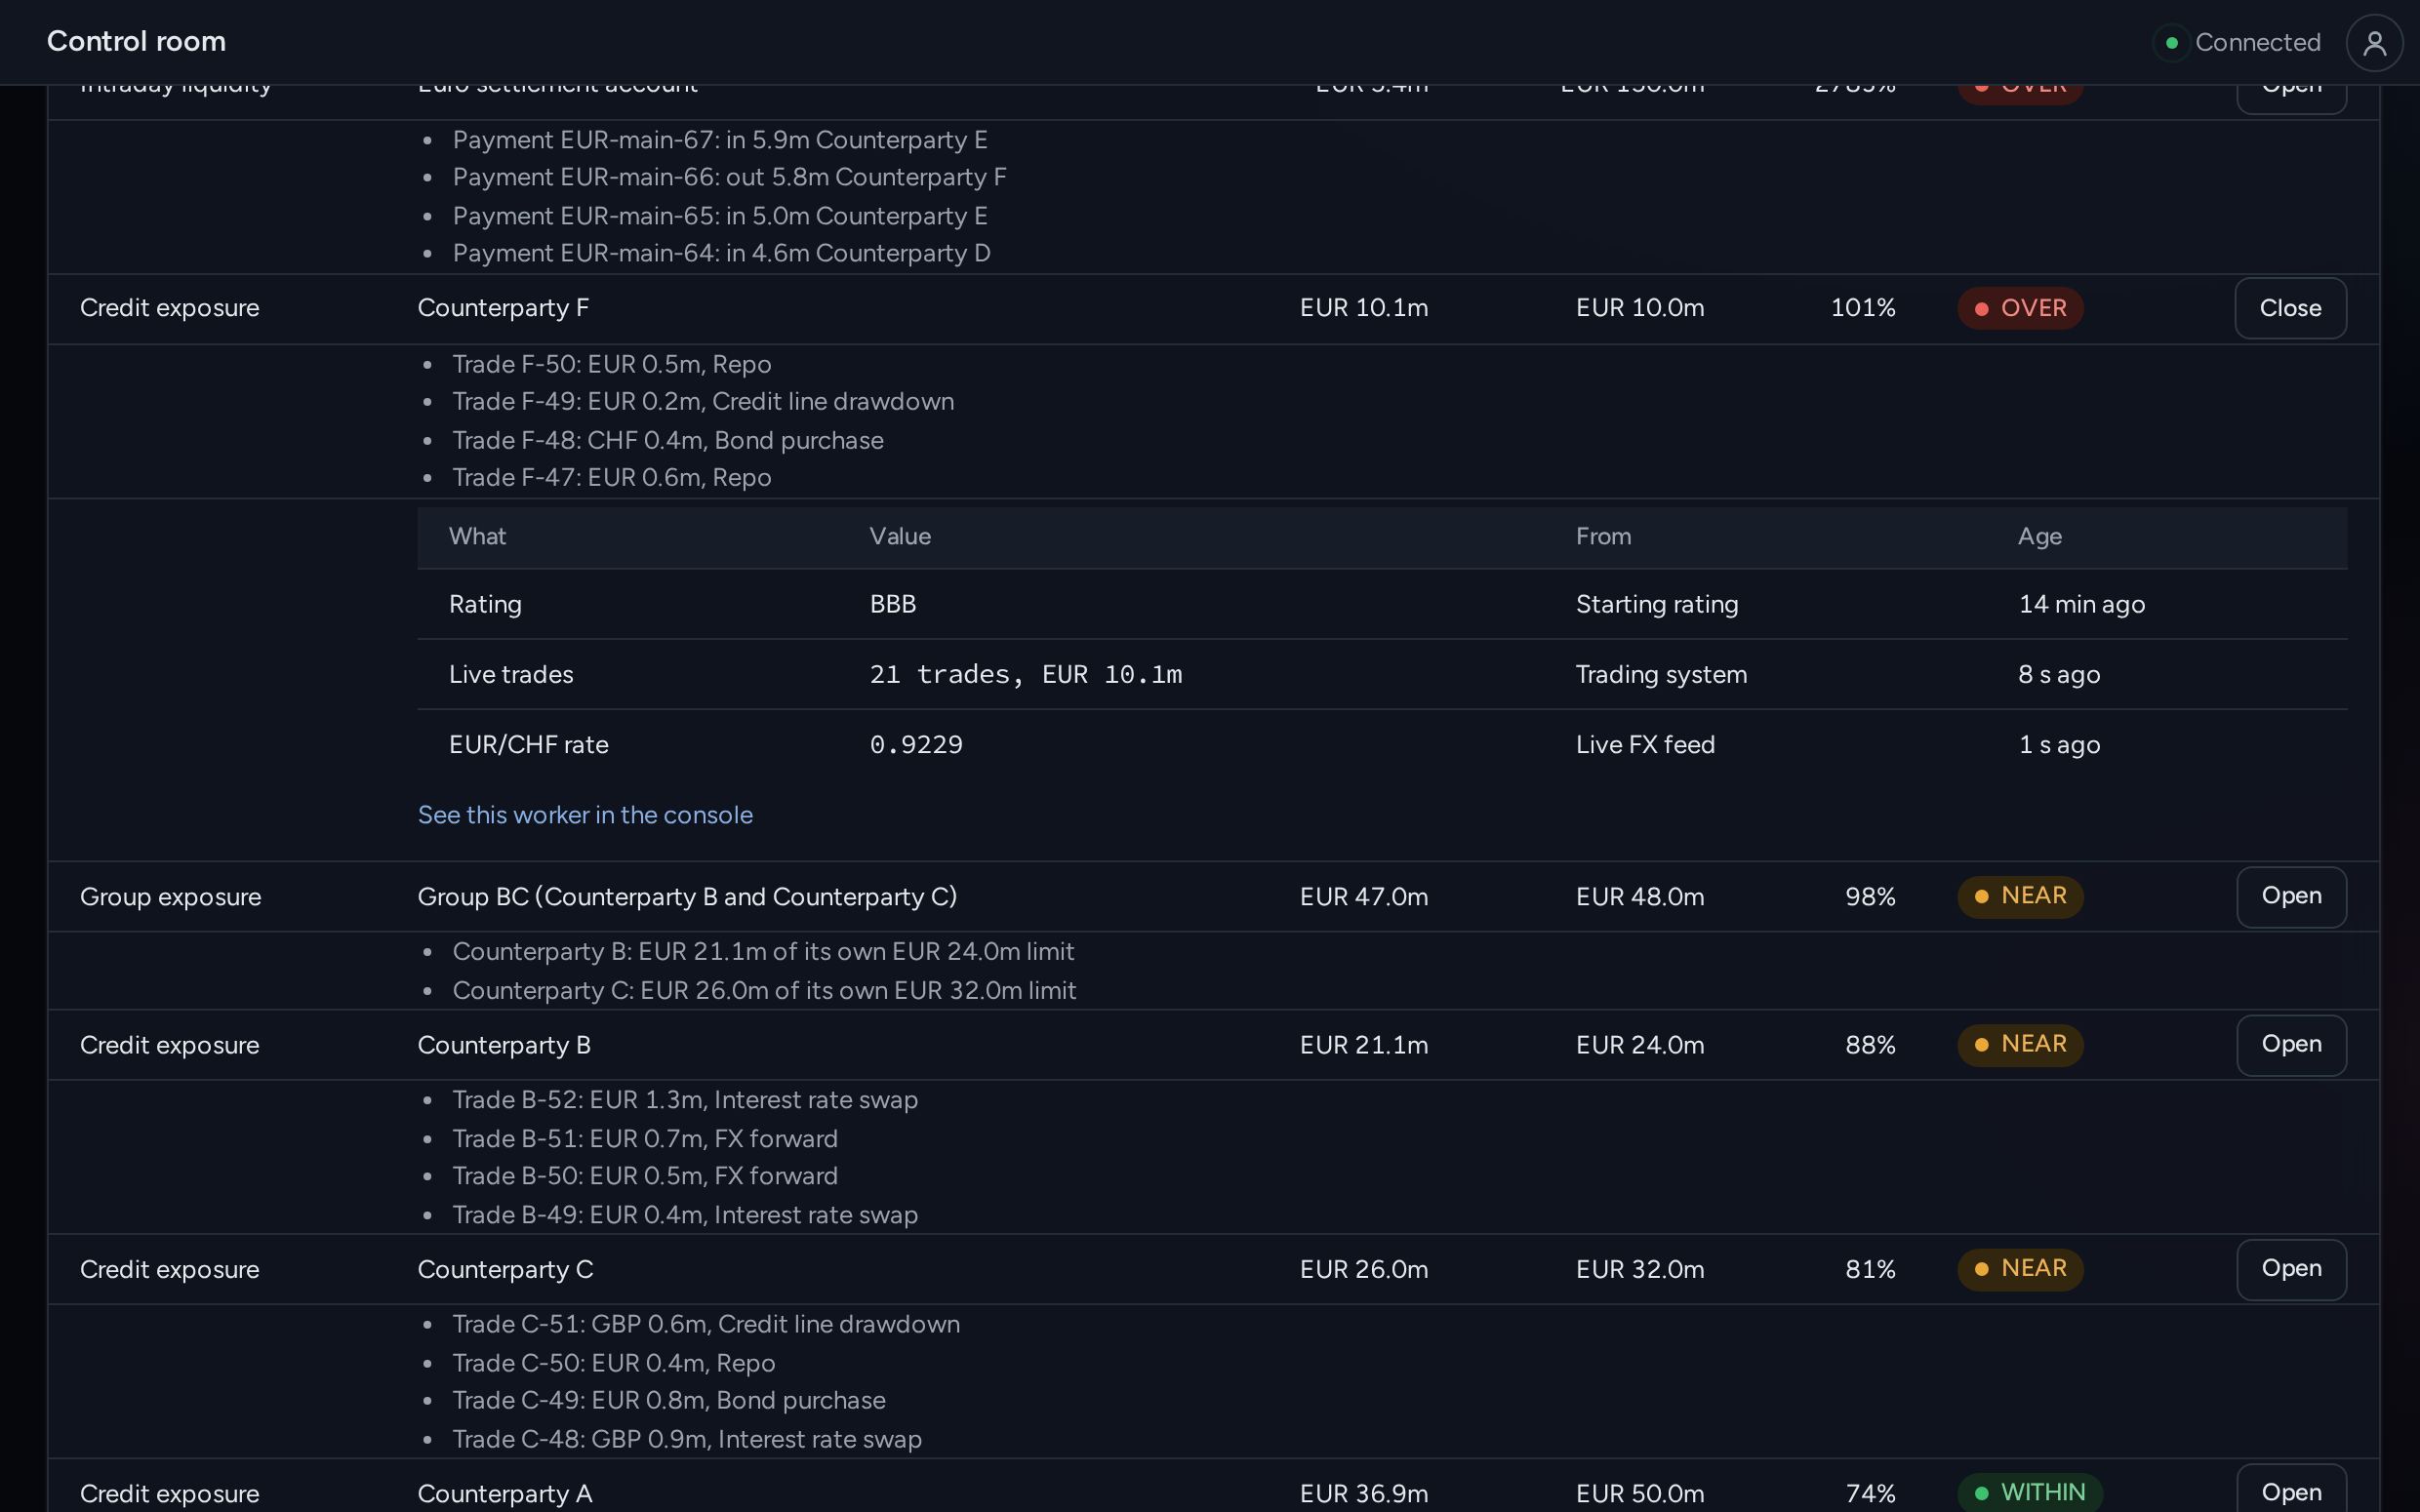
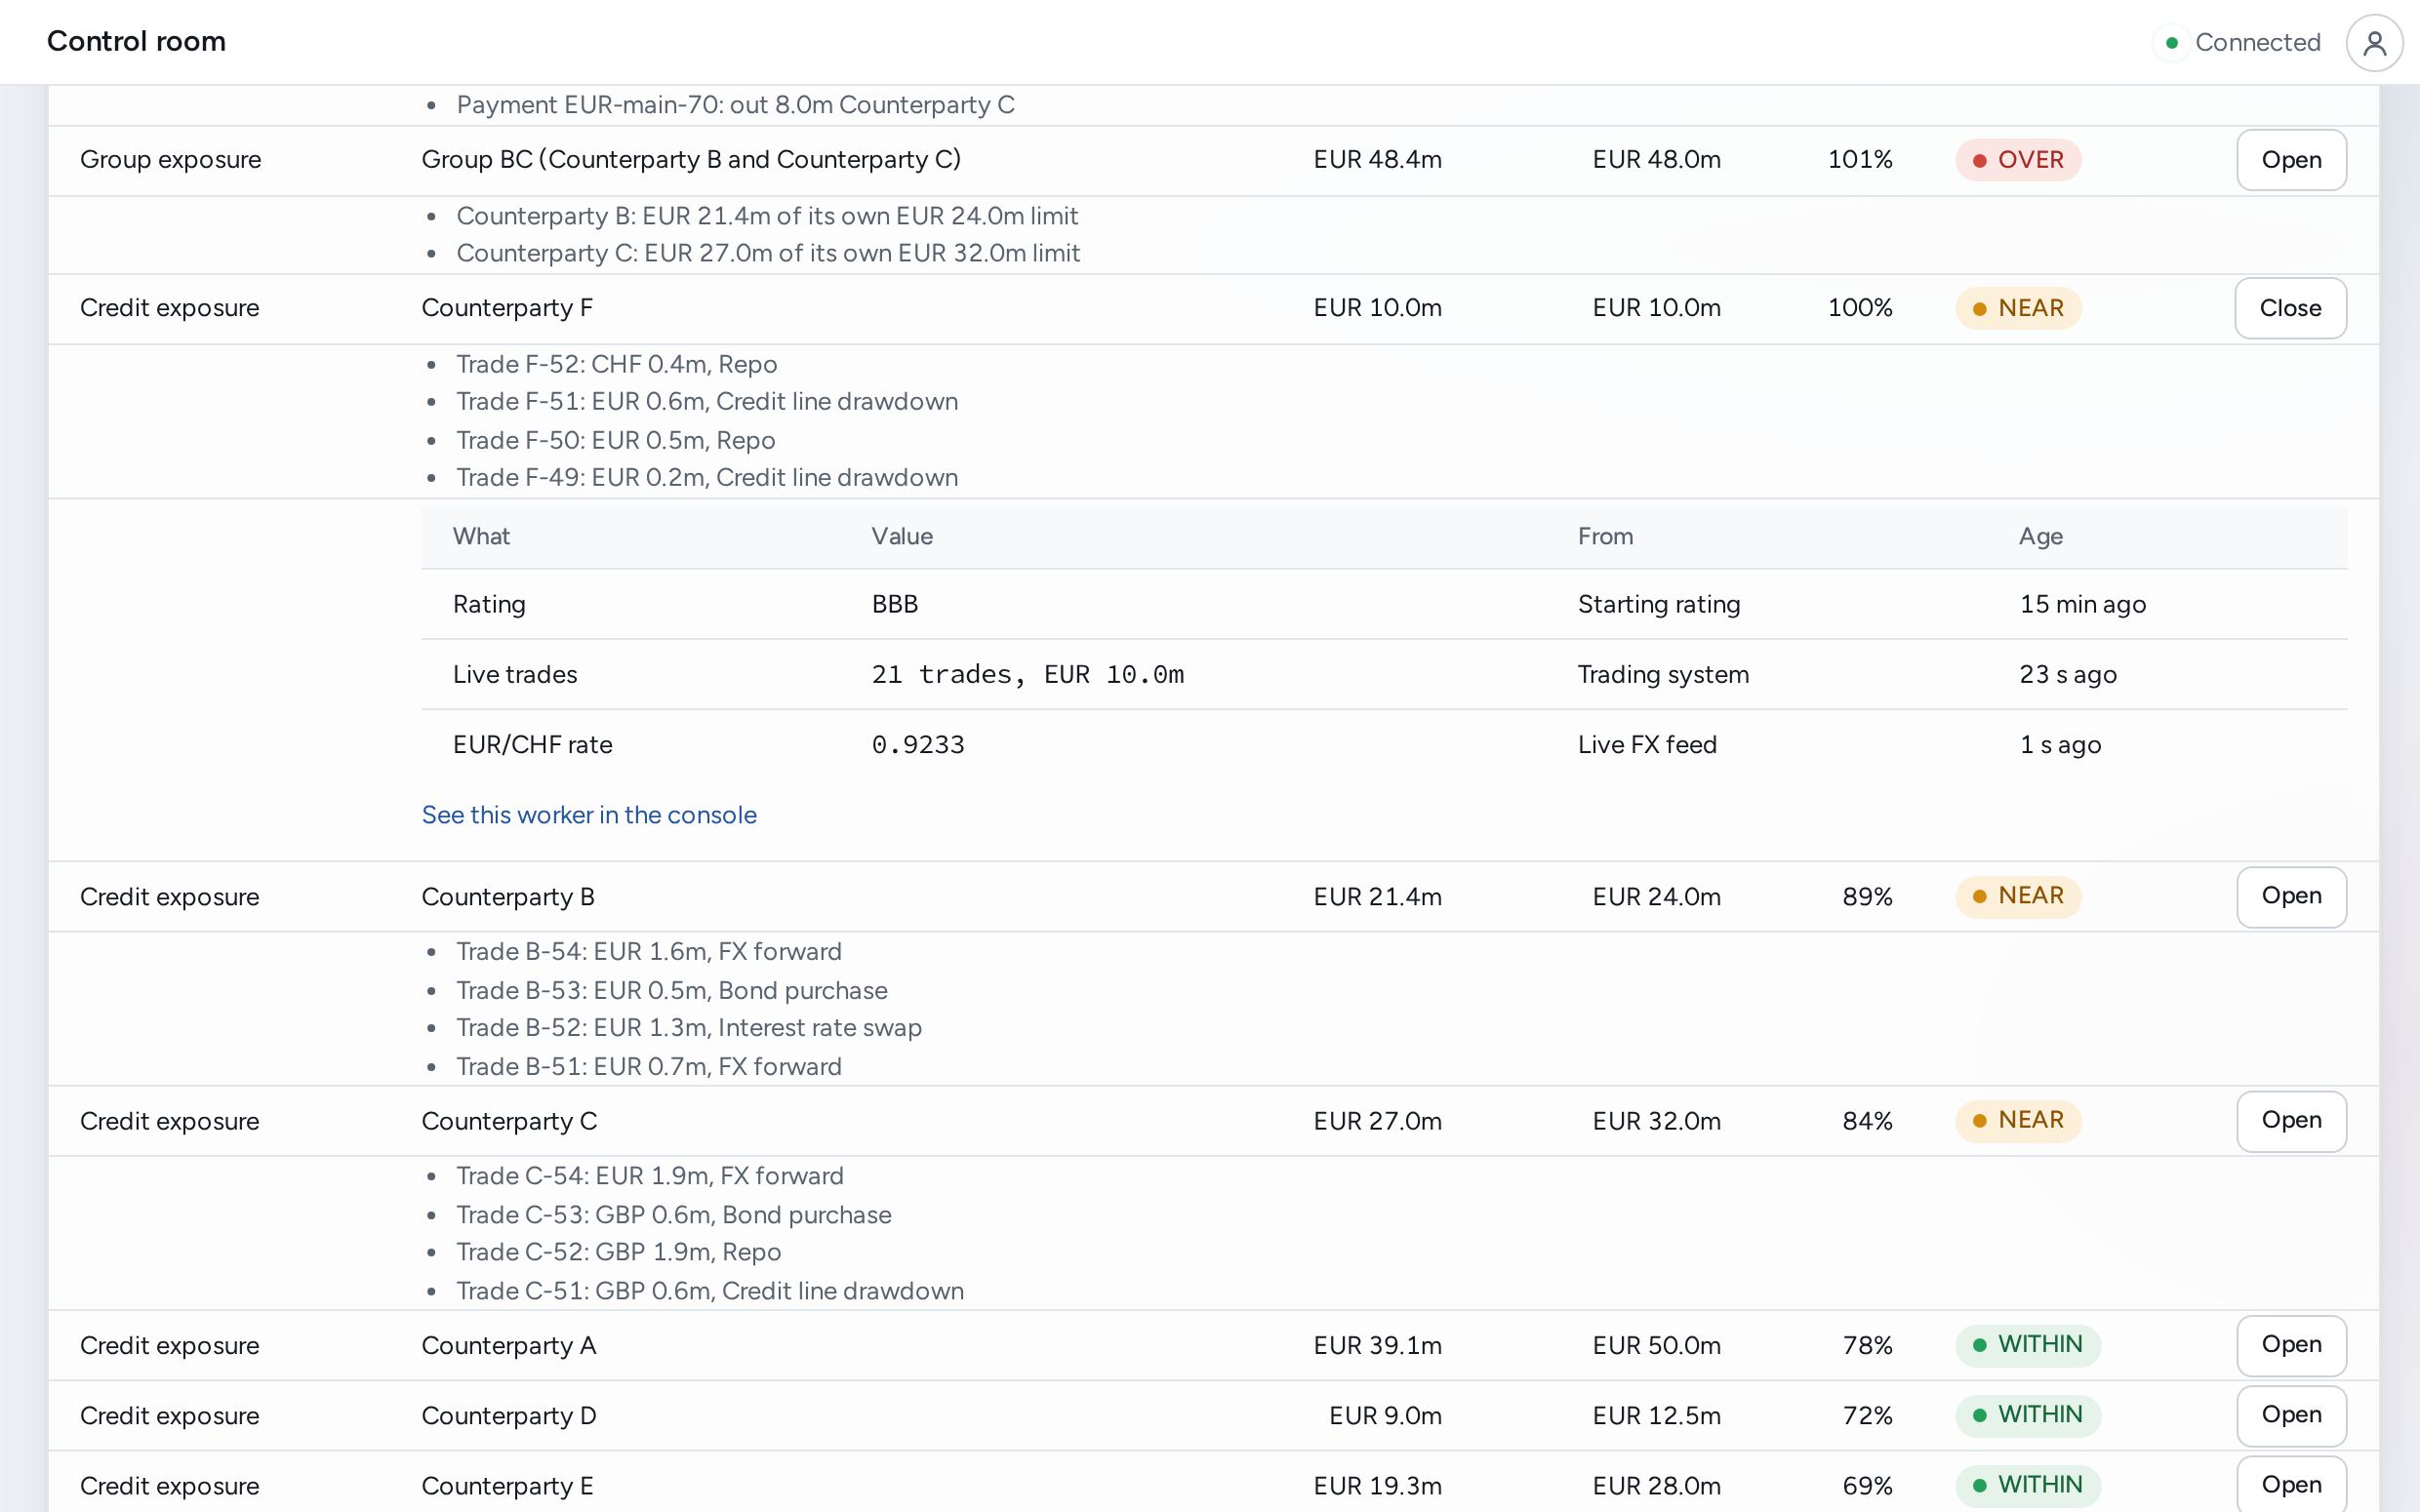
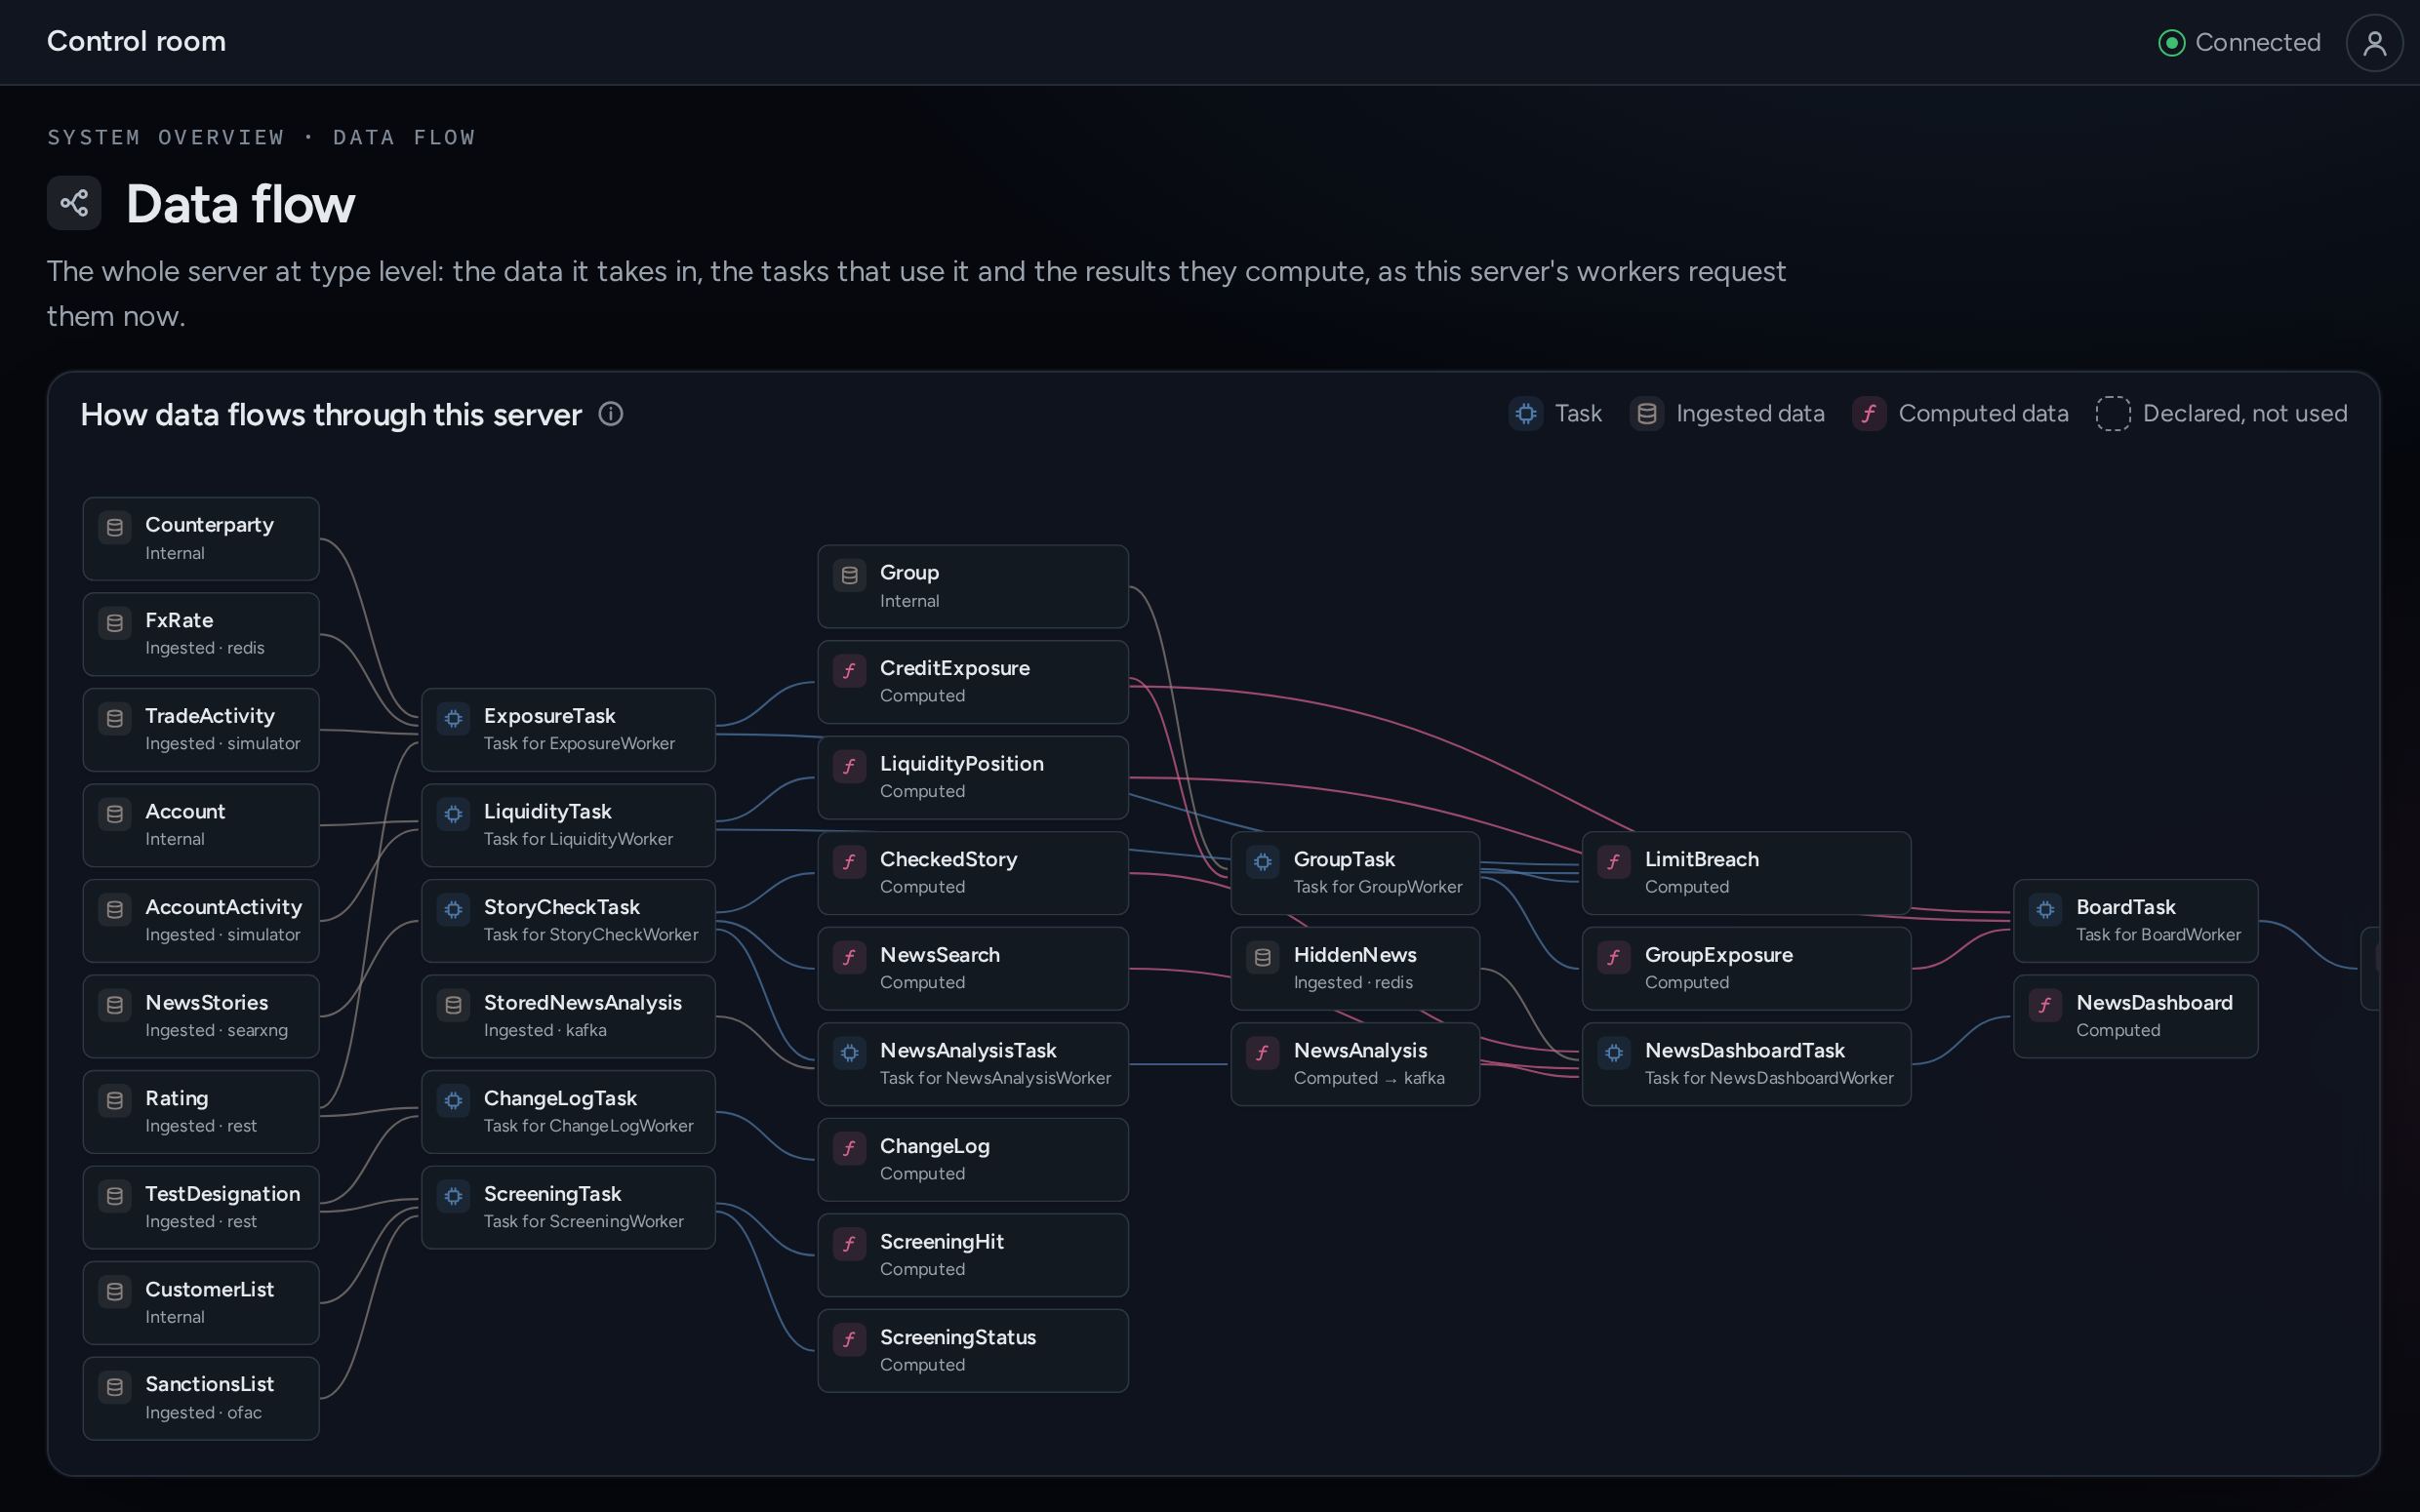
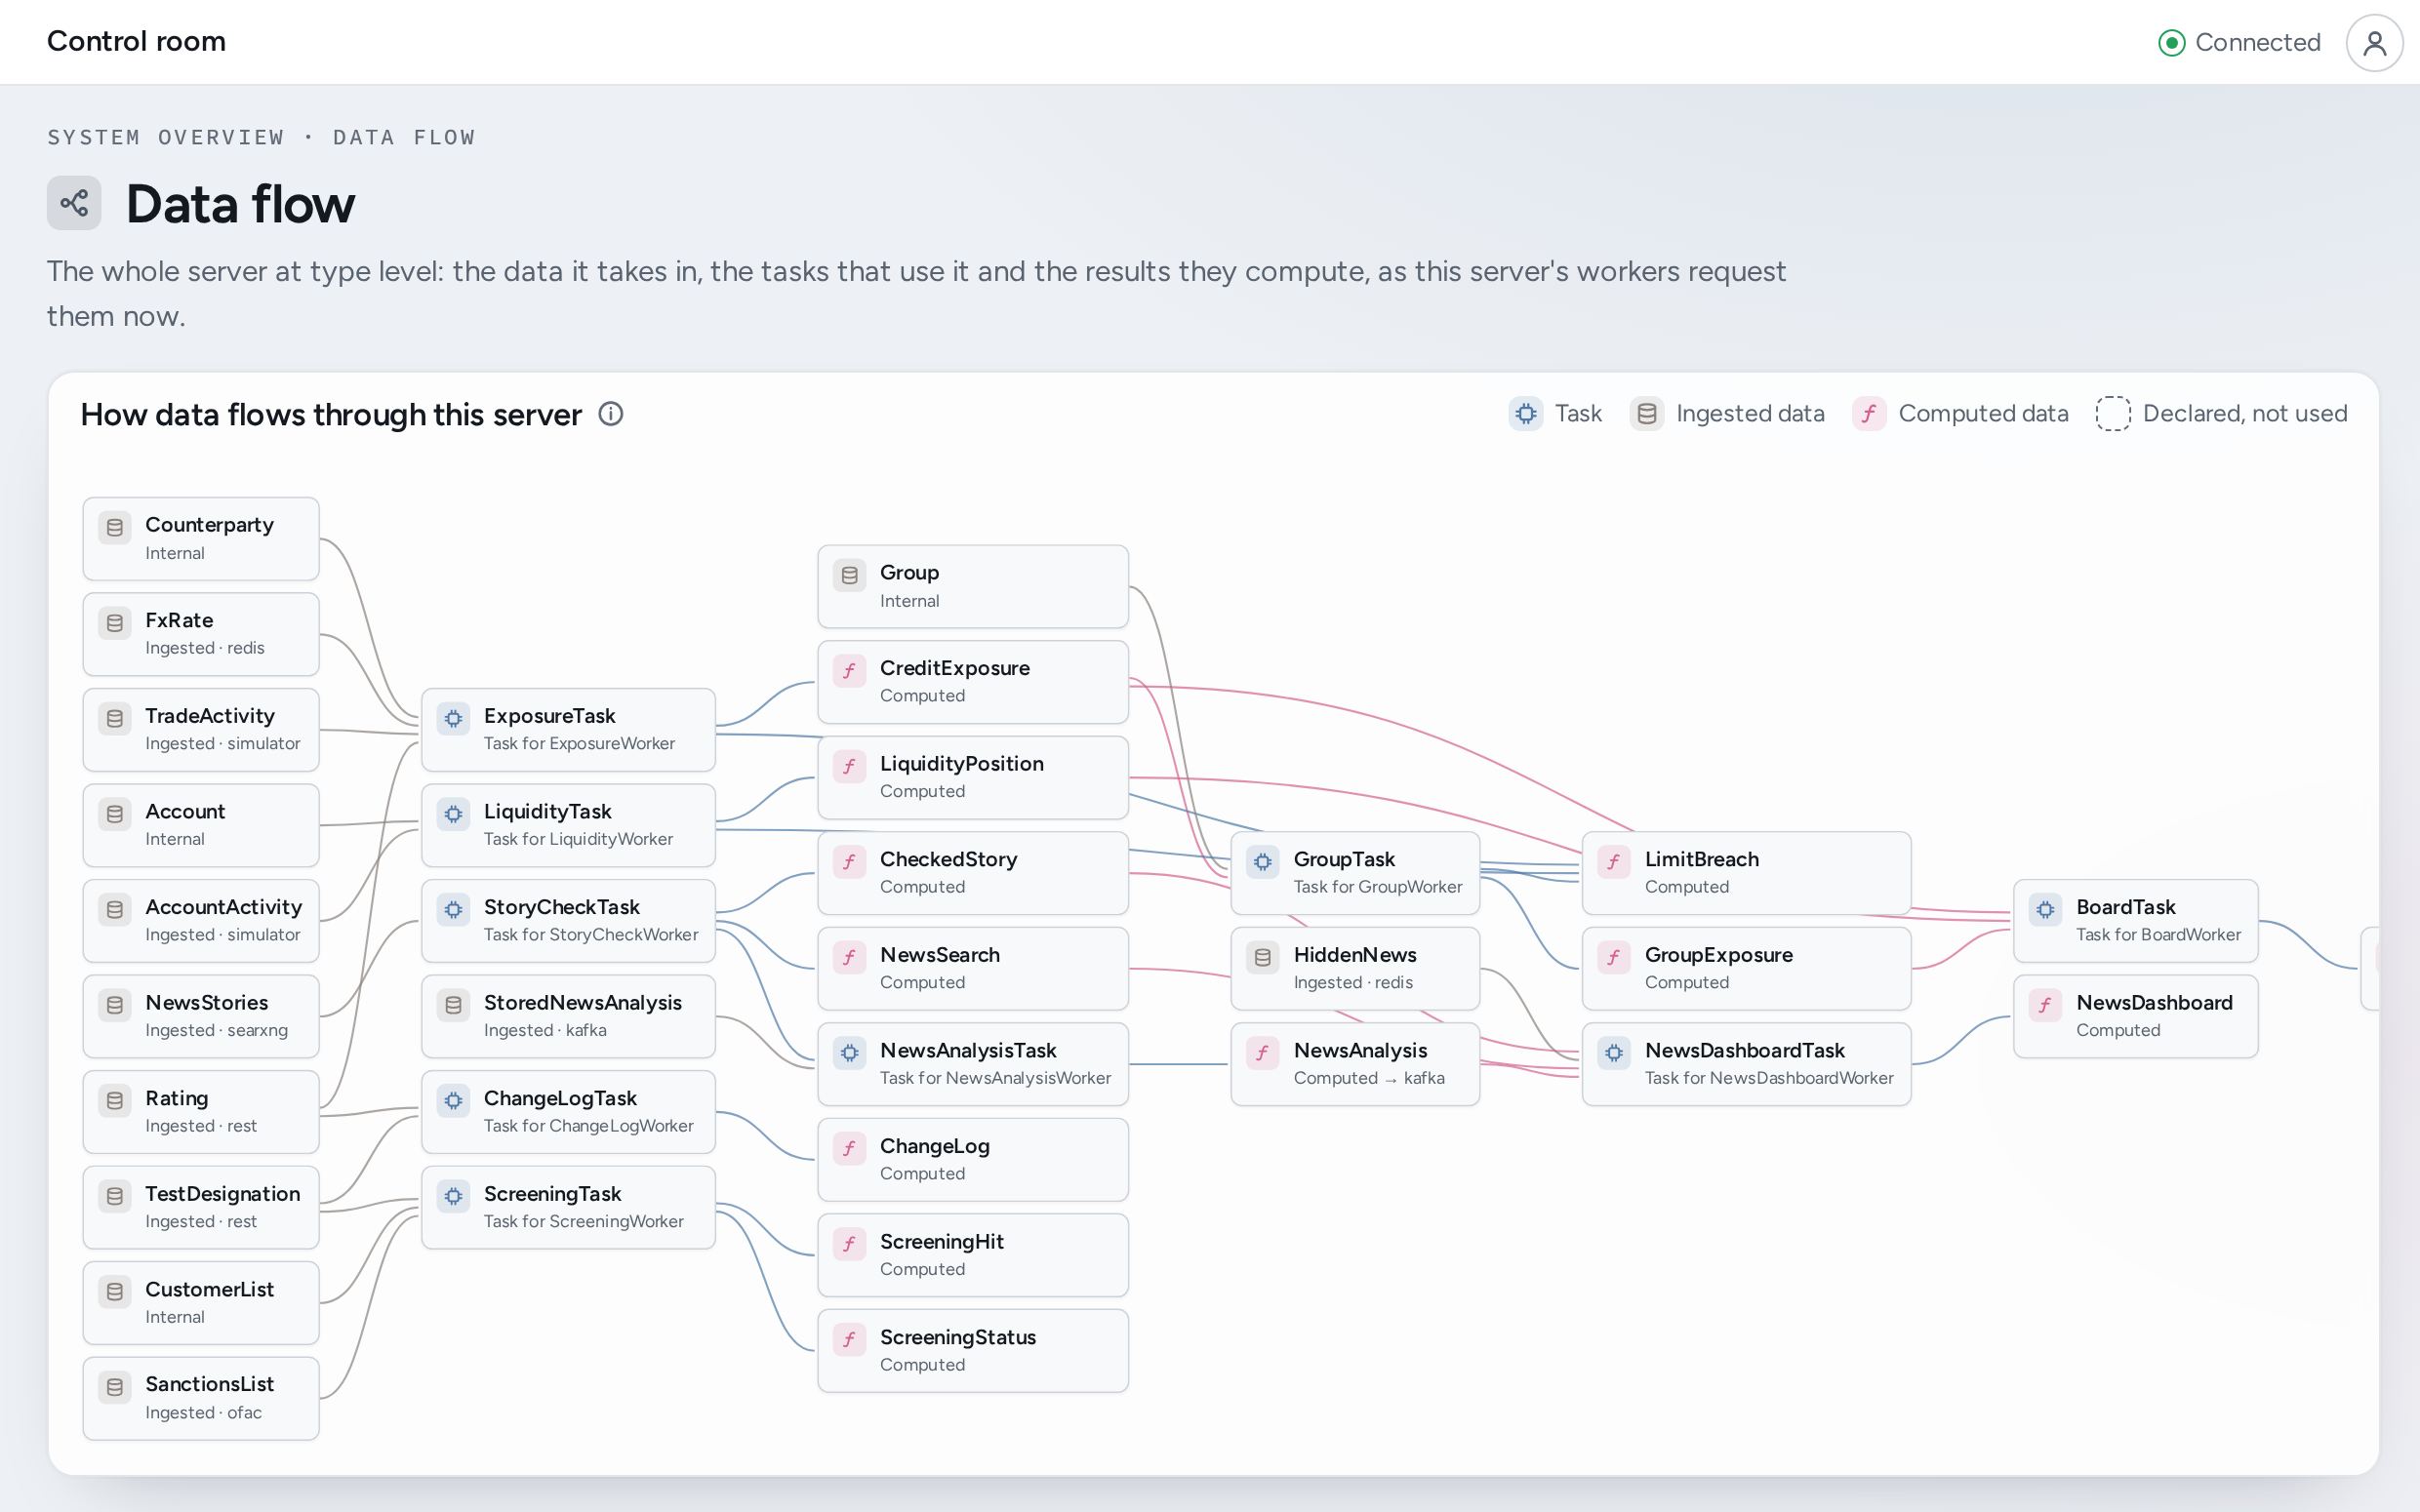
Use it yourself, no sign-in: Every limit, watched all day ↗ · How data flows through this server ↗
What changes for your team
Nobody spends days working out which inputs a figure was calculated from. The figure shows them.
Overrides made in Excel go back through checks, and the log says who posted each one and when.
What your regulator or auditor gets
How it starts
Choose one that took too long to explain the last time someone asked.
Read from the systems that already produce it. Nothing is replaced.
Your developers, or ours, write it once. Calseda shows the exact inputs behind each result.
Run it alongside today's process, and put to it the questions your auditors asked last time.
Become a design partner: a pilot on generous terms, in exchange for a case study published only with your approval.